T1.1
Impact of herbivory by domestic and wild ungulates under a drought scenario
Partners:
ENFI
UNIMOL
CNR
UGR
UM6P
PNGP
UC
Active:
Year 1, Year 2, Year 3
WP1 analyses the biotic and ecological responses of wet meadows and snowbed grasslands to disturbances and restoration actions, combining field work and remotely sensed variables across all study sites.
All sites (Sierra Nevada, Serra da Estrela, Apennines, Gran Paradiso and High Atlas) take part in one or more tasks, building an experimental gradient of wet meadows per site according to their humidity and to livestock and tourist pressure. Along this gradient we study the health status of wet grasslands (taxonomic, structural and functional diversity; ecological interactions) using fixed plots and transects, with semi-monthly or monthly field campaigns during the growing season. WP1 extends large databases collected in previous projects to quantify the temporal effect of global change.
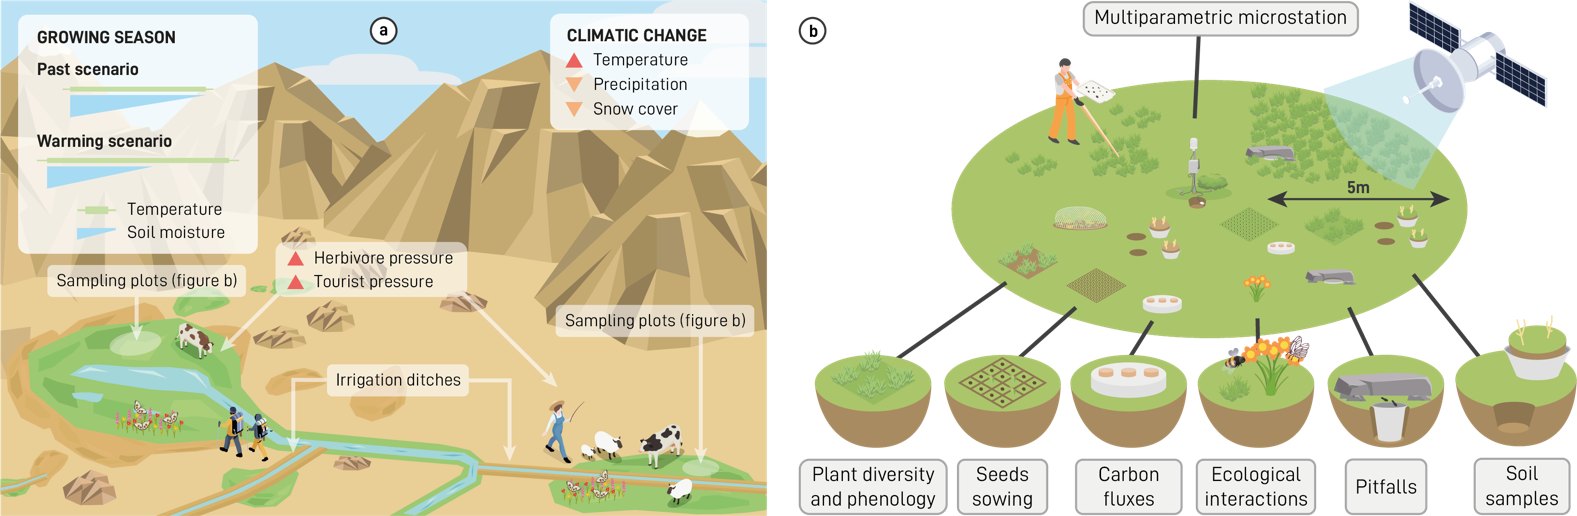
Herbivory impact will be assessed through visual estimates of consumption and trampling, and by comparing vegetation activity inside and outside exclosures with satellite remote sensing. Ungulate droppings will be quantified in fixed plots and transects as an estimator of herbivore abundance and organic inputs, and screened for seeds of potentially invasive species. Field campaigns every 15–30 days (May/June to September/October) will be compared with automatic surveillance using convolutional neural networks on camera-trap videos.
Field sampling of damage from trampling and from small shelters built by visitors in wet meadows next to streams and ponds, and quantification of litter and macro- and micro-plastics in fixed plots and transects every 15–30 days. Results will be compared with AI-based automatic visitor surveillance on camera traps and with the density of geotagged photos and texts shared on social media.
Diversity (taxonomic, structural, functional) and abundance of herbaceous species in fixed 1 m² plots nested within satellite pixels (Sentinel-1/2, Landsat-8/9), sampled monthly. Plant metrics will be compared with spectral diversity from a pole-mounted hyperspectral camera, and field phenology with land-surface phenology. Every 15–30 days we will also sample birds (point counts), arthropods on vegetation including floral visitors (5 × 2 m transects) and soil arthropods (pitfall traps), and relate field diversity to satellite-derived Ecosystem Functional Types and Attributes.
Lower soil moisture is expected to limit decomposition and the activity of roots and microorganisms. In the same plots, soil CO₂/CH₄ emissions will be measured with portable chambers (LI-COR 8200-01S Smart Chamber) and trace-gas analysers (LI-7810), while soil and air temperature, humidity and soil CO₂ are recorded continuously to estimate respiration every 30 minutes. Field estimates will be compared with satellite indices to model these variables regionally.
All field points follow a nested design according to the pixel size of WorldView-3, Planet, Sentinel-1/2 and Landsat-5/7/8/9. Remote-sensing variables and field measurements will be used to model essential biodiversity and climate variables (land surface temperature, soil moisture, snow, photosynthetic phenology, primary production, soil respiration, alpha and beta diversity…) and to track dynamics, trends and anomalies. The work builds on MonitorEO, a Google Earth Engine tool developed by UGR, LifeWatch ERIC and FIDESOL in the SmartEcoMountains project, designed under FAIR principles for three user profiles: researchers and managers who code, those who don’t, and the general public.
Time series of satellite-derived variables will be compiled to describe composition (land cover, habitat types), structure (biomass, extent, fragmentation, heterogeneity, LAI, shrub size structure) and function related to water (soil and vegetation moisture, evapotranspiration, snow cover, hydroperiod), energy (temperature, albedo, radiation) and carbon (greenness, phenology, seasonality), from MODIS, Landsat and Sentinel and complemented with LiDAR. Ecosystem Functional Attributes (e.g. NDVI annual mean, seasonal SD and CV, dates of maximum and minimum) will be screened with PCA and correlation analyses to select candidate essential variables.
Reference dynamics (average seasonal curve and its interannual variability) will be established for every variable. Long-term trends will be assessed with Mann–Kendall and Sen’s slope tests, and anomalies will be computed as early warnings of ecosystem change. Spatial variability will be described through Ecosystem Functional Type heterogeneity and Ecosystem Functional Diversity (richness, rarity), revealing functional homogenisation or heterogenisation of landscapes.
Species distribution and abundance models fed with remote sensing, ecohydrological outputs and ancillary data will assess the conservation status of iconic pilot species (Habitats Directive, IUCN) selected with local managers, using a multiscale ensemble to compute a Habitat Suitability Index and Mann–Kendall trends of yearly models. We will also identify dominant winner and loser woody species in each mountain (e.g. Juniperus spp. in Sierra Nevada), supported by field data from existing monitoring programmes and AI-based detection in camera-trap, satellite and drone images.

PRESINMED is funded through the 2023–2024 Biodiversa+ joint call for research proposals “Nature-based solutions for biodiversity, human well-being and transformative change” (BiodivNBS), with the national funders of the participating countries. Biodiversa+ is the European Biodiversity Partnership, co-funded by the European Commission.